Hello.
I tested the latest version of the components LinqConnect Professional Version 4.4.582 (11-Sep-2014).
And the problem has become even more. A memory leak has become a huge and began to appear at once at the start of the test.
Repeated with 100% probability.
To simplify the test, I removed the a lot of requests and kept that at least 100% which causes a memory leak.
In addition, the project I was a little changed and simplified.
Has changed the way to create the context and its removal.
That's part of the code:
Code: Select all
using System;
using System.IO;
using System.Reflection;
using Devart.Data.Linq;
using Devart.Data.Linq.Mapping;

namespace ceData.Context
{
    public class Service
    {
        private Stream _contextStream;
        private MappingSource _mappingSource;
        private ceDataContext _dataContext;

        public ceDataContext CreateDataContext(string sProviderPrefix, string sConnectionString)
        {
            _contextStream = Assembly.GetExecutingAssembly()
                        .GetManifestResourceStream("ceData.Context.ceDataContext" + sProviderPrefix + ".xml");
            _mappingSource = XmlMappingSource.FromStream(_contextStream);
            _dataContext = new ceDataContext(sConnectionString, _mappingSource);

            _dataContext.Connection.Open();

            return _dataContext;
        }

        public void DisposeDataContext()
        {
            _dataContext.Connection.Close();
            _dataContext.Dispose();
            _dataContext = null;

            _contextStream.Close();
            _contextStream = null;

            _mappingSource = null;
        }
    }
}
And here is a memory leak:
Code: Select all
        void SelectData(object data)
        {
            var comObjectId = (int)data;

            var service = new ceData.Context.Service();
            var cx = service.CreateDataContext(_providerPrefix, _connectionString);

            var concentrators = cx.Concentrators.Select(c => c);

            foreach (var con in concentrators)
            {

                var concentratorMeters = cx.Concentrators_Meters
                            .Where(c => c.Concentrator == con && c.IsCurrent && c.Meter.ComObjectId == comObjectId)
                            .Select(c => c.Meter);
                var dataType = cx.RefDataTypes.SingleOrDefault(dt => dt.DataTypeId == 3);

                dataType = null;
                concentratorMeters = null;
            }

            concentrators = null;

            service.DisposeDataContext();
        }
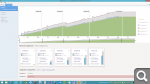
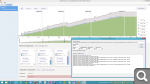
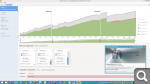
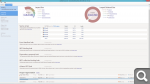
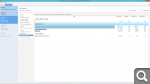
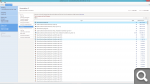
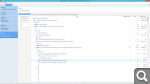
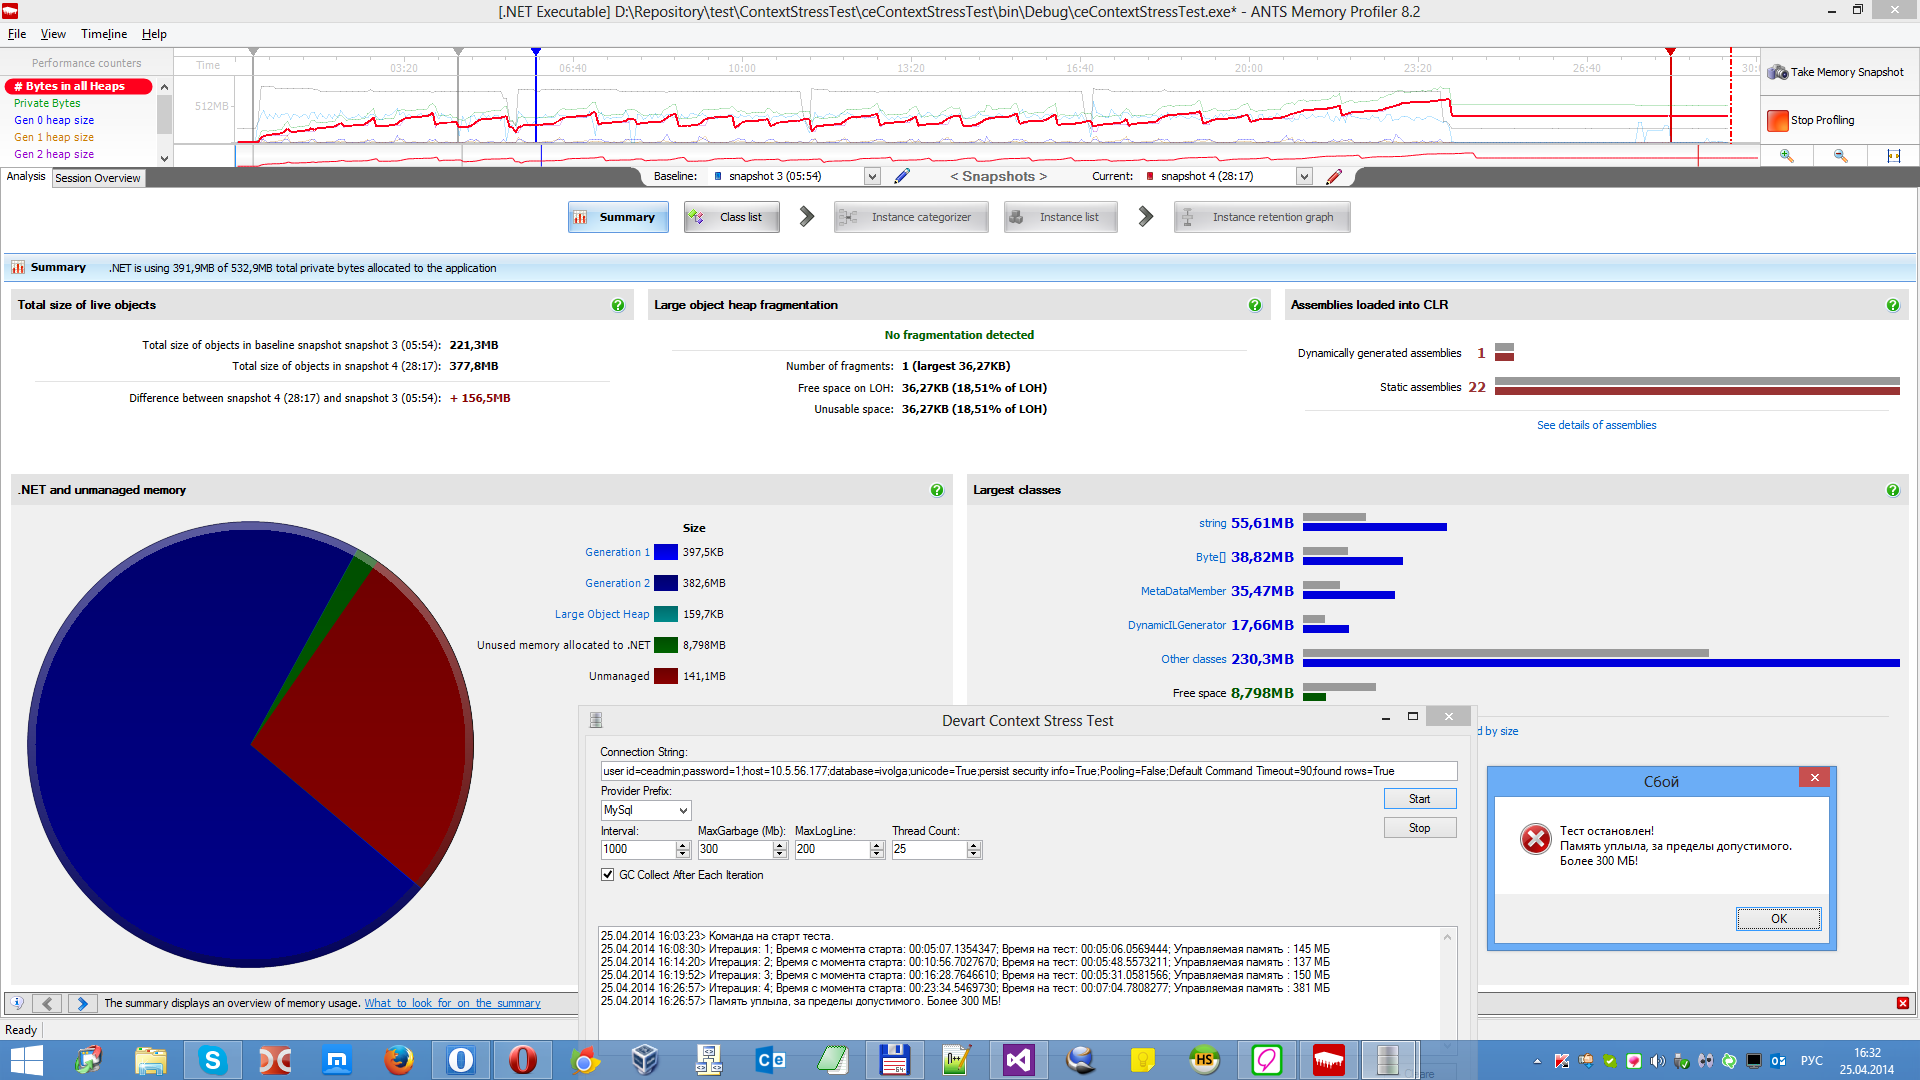
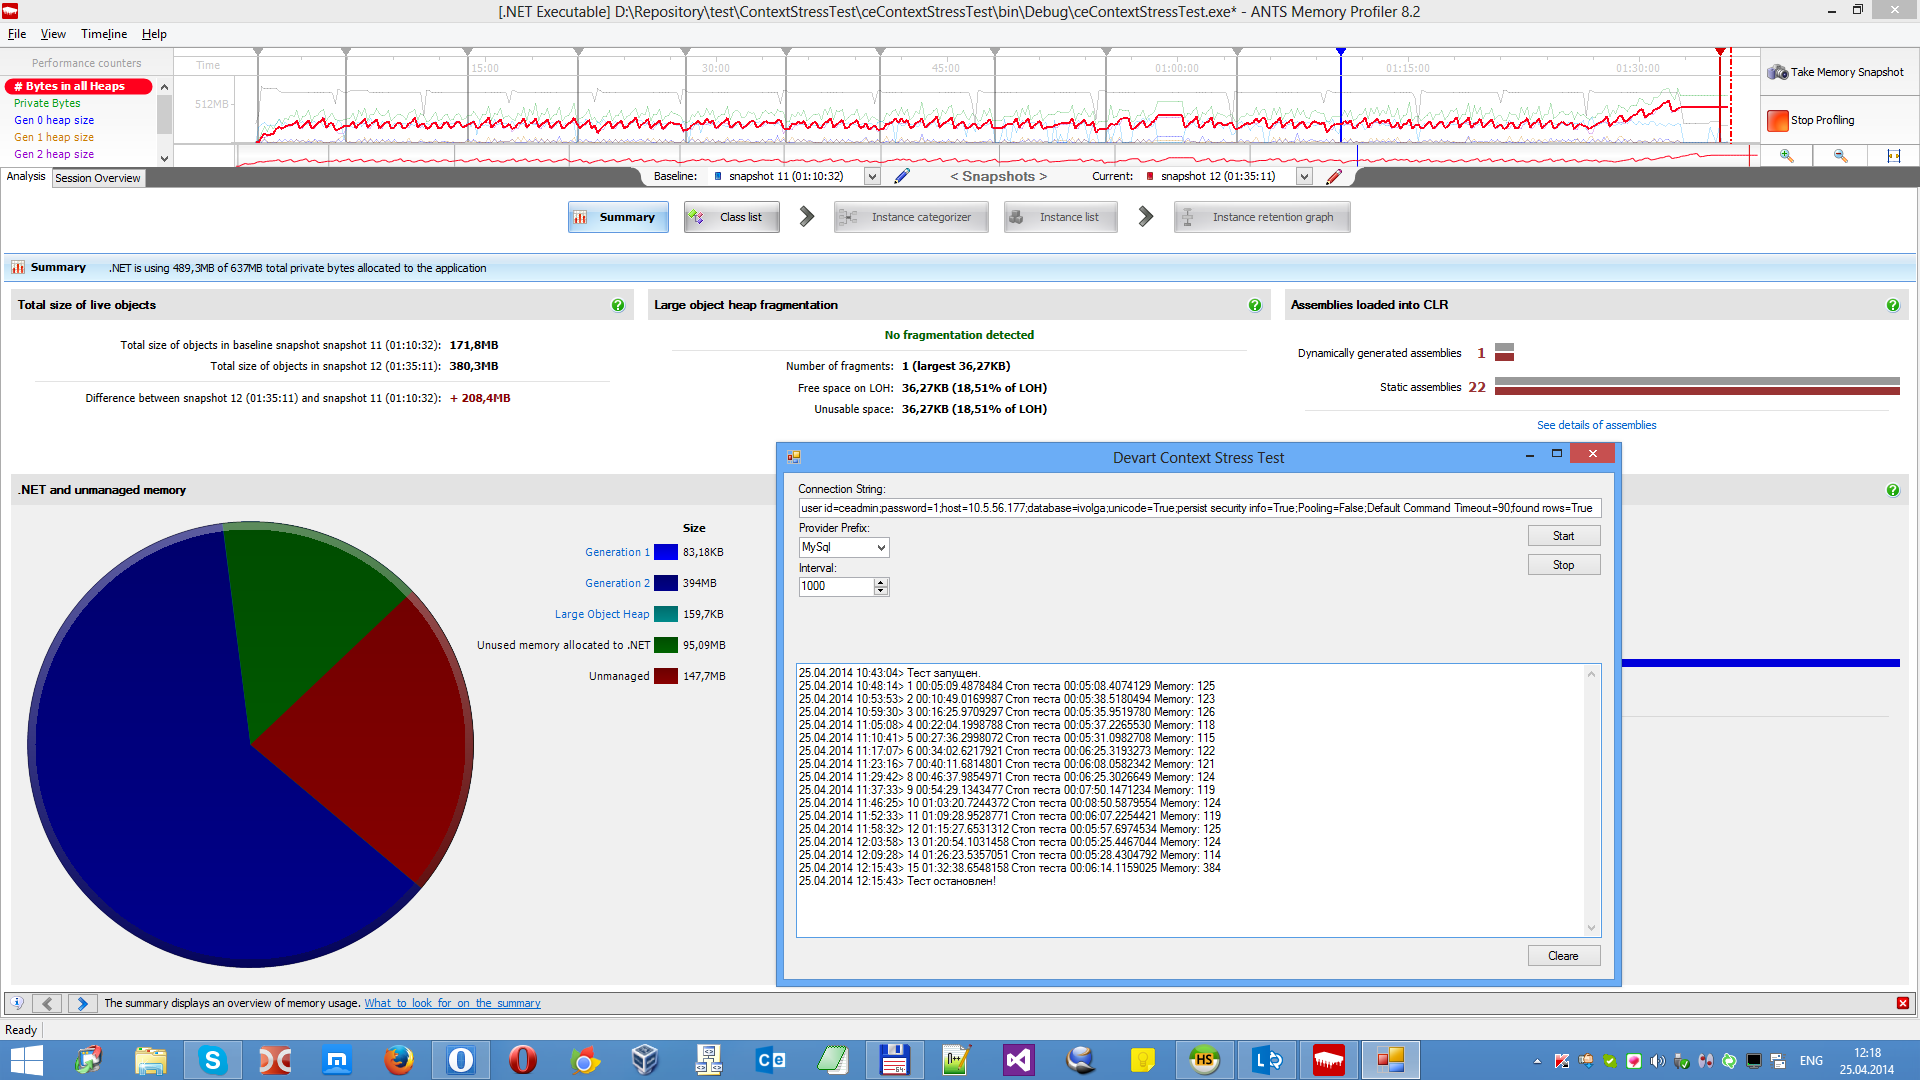
Without a foreach loop with sample data no leaks. Judging by the result of the profiler, the whole problem in the cache. The cache is not destroyed, but remains in the memory and there is a large memory leak.
However, as you can see all these actions do not help.
Very much I ask fix the problem as soon as possible.
That data for analysis.
The project with source code and database backup for MySQL (password for the archive sent separately).
ContextStressTest(Source+Database).exe.rar
48,7 MB (51 135 794 byte)
CRC32: 0B4E0B1B
MD5: 8628F51E759399C61F49C132FD93929D
SHA-1: 80EDAF698F1E97E6505031725C167DB8FDD873C8
http://nashdisk.ru/ab4650
Test results:
All archived programs WinRar 5.11, format RAR5 (older versions of WinRar does not support this format).
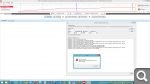
ceContextStressTest [2014-09-25] [17-53].Red Gate ANTS Memory Profiler 8
ceContextStressTest [2014-09-25] [17-53].Red Gate ANTS Memory Profiler 8.rar
505 MB (529 894 086 byte)
CRC32: 802C7F0A
MD5: EBA9B11602C7F37D99F5B703C1B7A103
SHA-1: C6B0E9C616428EBC12753BEFF965F9E054A41141
http://nashdisk.ru/2b3328
ceContextStressTest [2014-09-25] [17-53].Red Gate ANTS Memory Profiler 8.png
 ceContextStressTest [2014-09-25] [16-43].Jetbrains dotMemory 4.0
ceContextStressTest [2014-09-25] [16-43].Jetbrains dotMemory 4.0.part1.rar
450 MB (471 859 200 byte)
CRC32: 1884B9A5
MD5: 7F3E2CA1A36873AA17E856D9819CD6C5
SHA-1: 647A830111C190B1083EE9FC75A1FFA713566D6F
http://nashdisk.ru/e2a9d5
ceContextStressTest [2014-09-25] [16-43].Jetbrains dotMemory 4.0.part2.rar
450 MB (471 859 200 byte)
CRC32: E4A44884
MD5: 71319045B795DD3612E2E35D7C75A610
SHA-1: E08898C2F2F01DA0D977F98D868F2A85FBF07830
http://nashdisk.ru/89a62b
ceContextStressTest [2014-09-25] [16-43].Jetbrains dotMemory 4.0.part3.rar
450 MB (471 859 200 byte)
CRC32: 82AC2DA6
MD5: 91CBD0402280AB2CF81C7911EE5996C9
SHA-1: 9671729CF7432C8E95A706385E84FB86B52732A0
http://nashdisk.ru/047cc8
ceContextStressTest [2014-09-25] [16-43].Jetbrains dotMemory 4.0.part4.rar
229 MB (241 121 341 byte)
CRC32: 6A200F1E
MD5: 293C4DA9D06FDBB692DA10212B5A3872
SHA-1: 0951E5C36020E715E408055586AD158BE5FD3E93
http://nashdisk.ru/4d16de
ceContextStressTest [2014-09-25] [16-43].Jetbrains dotMemory 4.0 - 1.png
 ceContextStressTest [2014-09-25] [16-43].Jetbrains dotMemory 4.0 - 2.png
 ceContextStressTest [2014-09-25] [11-22].Jetbrains dotMemory 4.0
Only screenshots, since the size of the result of the profiler is very large.
ceContextStressTest [2014-09-25] [11-22].Jetbrains dotMemory 4.0 - 1.png
 ceContextStressTest [2014-09-25] [11-22].Jetbrains dotMemory 4.0 - 2.png
 ceContextStressTest [2014-09-25] [11-22].Jetbrains dotMemory 4.0 - 3.png
 ceContextStressTest [2014-09-25] [11-22].Jetbrains dotMemory 4.0 - 4.png
 ceContextStressTest [2014-09-25] [11-22].Jetbrains dotMemory 4.0 - 5.png
![ceContextStressTest [2014-09-25] [17-53].Red Gate ANTS Memory Profiler 8.png](http://s7.hostingkartinok.com/uploads/images/2014/09/daf1efbc4151de8964260ecab254036f.png)
![ceContextStressTest [2014-09-25] [16-43].Jetbrains dotMemory 4.0 - 1.png](http://s7.hostingkartinok.com/uploads/images/2014/09/b9a890dfff67f33e923a56cb94ab0ea3.png)
![ceContextStressTest [2014-09-25] [16-43].Jetbrains dotMemory 4.0 - 2.png](http://s7.hostingkartinok.com/uploads/images/2014/09/ae647af04a29bb0795d5b32eaa53509b.png)
![ceContextStressTest [2014-09-25] [11-22].Jetbrains dotMemory 4.0 - 1.png](http://s7.hostingkartinok.com/uploads/images/2014/09/54b1ccab83da044da83c77a2f81baf83.png)
![ceContextStressTest [2014-09-25] [11-22].Jetbrains dotMemory 4.0 - 2.png](http://s7.hostingkartinok.com/uploads/images/2014/09/b9ecf29efec257e4dd10fa5dead5408b.png)
![ceContextStressTest [2014-09-25] [11-22].Jetbrains dotMemory 4.0 - 3.png](http://s7.hostingkartinok.com/uploads/images/2014/09/876bcc56aed5b8e749c147805c1f4312.png)
![ceContextStressTest [2014-09-25] [11-22].Jetbrains dotMemory 4.0 - 4.png](http://s7.hostingkartinok.com/uploads/images/2014/09/c70651be5da45b6accff97515ea9d083.png)
![ceContextStressTest [2014-09-25] [11-22].Jetbrains dotMemory 4.0 - 5.png](http://s7.hostingkartinok.com/uploads/images/2014/09/7f8b341370be3c960e070d4740b48cc3.png)